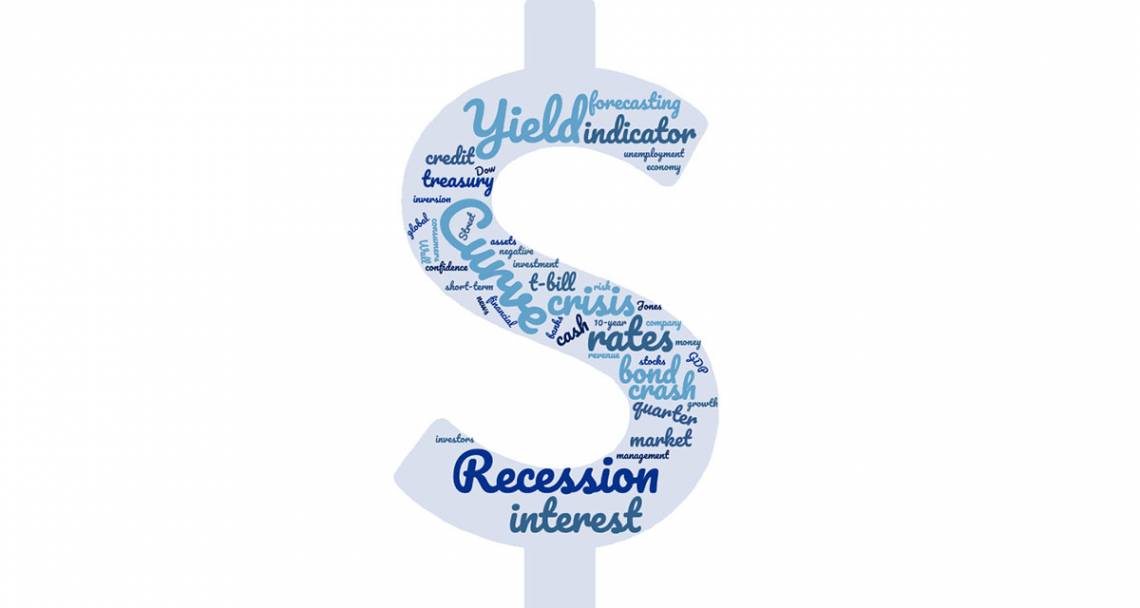
It's Official: The Yield Curve is Triggered. Does a Recession Loom on the Horizon?
Campbell Harvey explains the yield curve and what makes it an accurate economic predictor
 In 1986, Campbell Harvey published his dissertation linking yield curve inversions (rare situations when short-term interest rates exceed long-term rates) to recessions. He studied the four recessions from the 1960s to 1980s and his indicator proved to be accurate.
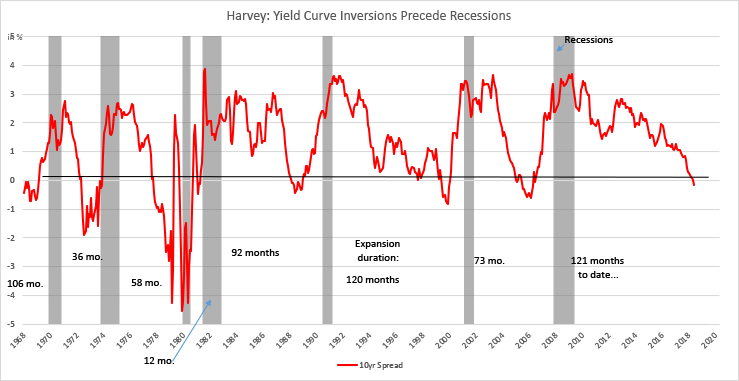
In the three recessions that followed his dissertation, the yield curve again inverted before each one –including the 2008 global financial crisis.
June 30 marked the day where the yield curve was inverted for a full quarter -- triggering a recession forecast.
“You can’t just look at the seven-for-seven track record. For example, you could have an indicator that fires every quarter (always forecasting recession). It is correct but it has a lot of false signals,” said Harvey, now a finance professor at Duke University’s Fuqua School of Business. “For my model, there have been no false signals yet.”
A more detailed Q&A follows below.
What is the yield curve?
Harvey: The yield curve represents the difference in interest rates across different maturities. For example, a Treasury bill might have a much different yield to maturity than a 30-year government bond. The rates at different maturities are called the yield curve or the ‘term structure.’
What is a yield curve inversion?
Harvey: Normally, long-term interest rates are higher than short-term rates. Think of a Certificate of Deposit at your bank. If you lock your money in for 5 years, it is almost always for a higher rate than for, say, a six-month CD. So a normal yield curve is positive, meaning longer maturity at a higher rate. However, in rare occasions, this can flip around and we get short-term rates that are higher than long-term rates. This is exactly the situation that we are in today.
Why is an inverted yield curve a bad omen?
Harvey: Flat or inverted yield curves are historically associated with slow economic growth or recessions. I did notice that the yield curve inversion of the 10-year Treasury bond and the 3-month Treasury bill yield curve preceded all four recession since the 1960s. My dissertation committee at the University of Chicago was concerned that this might be a fluke given there were only four recessions. Frankly, I was nervous too because it is well known in science that strong findings become weaker after publication -- or sometimes vanish. However, in my case, this did not happen. Yield curve inversions preceded each of the next three recessions, including the important global financial crisis.
Why does this indicator work?
Harvey: There are many different ways to understand why the yield curve is a useful forecasting tool. I think the simplest is the following. The safest asset in the world is the U.S. 10-year Treasury bond. When people believe there is increased risk of a crisis or a recession, they shift their assets into this bond. This is sometimes known as a ‘flight to quality’. Buying pressure on the 10-year drives prices up, thereby lowering yields. The long-term yield can be lowered to such an extent that it ends up below the short-term yield – an inverted yield curve. So think of the yield curve as an indicator of sentiment about the future of the economy and the risks we face. Yield curves are 90 percent of the time ‘normal’ (meaning longer-term rates exceed short-term rates). However, on those occasions when they are inverted, it is almost always bad news.
How can this indicator be flashing recession when GDP is growing at a robust 3.1 percent and unemployment is 3.6 percent -- a 50-year low?
Harvey: GDP growth tells us about the past. Earnings growth tells us about the past. The unemployment rate is a well-known ‘lagging indicator’ of the business cycle. The yield curve provides a window into the future. When you buy a bond, the cash flows come in the future in the form of interest payments and principal.
The yield curve inversion is relatively minor with the 10-year bond in June 2019, having only a 0.11 percent lower yield than the three-month Treasury bill. Why can’t the Fed fix this by lowering the Fed Funds rate by 0.25 percent?
Harvey: The Fed’s ability to control the yield curve is limited. Yes, the Fed does have substantial influence over the short-term rate. However, if the Fed cut the short-term rate by 0.25 percent, it does not immediately follow that the yield curve goes from -0.11 percent to +0.14 percent. There is a big leap of faith – that nothing happens to the 10-year rate. I seriously doubt that is what would happen. When the Fed cuts rates, that is usually associated with bad news. A cut of the short-term rate could lead to a flight to quality in the long-term bond, which would further depress yields.
“The yield curve does not cause a recession in my framework. The yield curve is just an elegant way to summarize sentiment in the economy.”
Is the yield curve inversion is a self-fulfilling prophesy?
Harvey: The yield curve does not cause a recession in my framework. The yield curve is just an elegant way to summarize sentiment in the economy. Indeed, no one much noticed when my dissertation was published in 1986. I did get a few notices in October 1987 when I predicted 4 percent real economic growth in 1988 when the consensus of economists was for negative growth after the stock market crash. A few noticed the successful forecasts for the 1990-91 and the 2001 recessions. However, the yield curve was put in the spotlight after the successful forecast of the global financial crisis. So, it is possible that the model is now causal. After noticing the track record of this model and given the yield curve is now inverted, some companies potentially cut back on investment and hiring – contributing to a slowdown.
Aren’t you worried about the self-fulfilling prophesy?
Harvey: No. Suppose you are a company thinking of making a major investment in a new plant and you have to borrow a lot to do that. You see the yield curve inversion and decide to delay the project to be prudent. Yes, this could cause some slowing in growth. Now let’s think of an alternative. The company ignores the yield curve, borrows money, invests in this project, a recession occurs and the company goes bankrupt, potentially costing thousands of jobs. What’s better – slowing down the rate of hiring or suffering a shock that is painful for both investors and everyone associated with the company? This is all about risk management. With a better forecasting tool, companies can make decisions that maximize the chances that they can ride out bad economic news with minimal impact to their stakeholders.
You have talked about companies’ capital investment and employment plans, what about the average consumer.
Harvey: Again, this is all about risk management and it doesn’t matter if you are a company or a consumer. Suppose you are planning that family vacation to Orlando and you will have to run your credit card up to pay for it. The yield curve inverts. To me, it is prudent to take a less expensive vacation this year. The most important risk management tool for consumers is savings. It is important to have a buffer if we fall into a recession.
Are there other indicators that we should watch to help us forecast a recession?
Harvey: Yes. My model is very simple – it is a single variable, the yield curve. The world is much more complex. There are three other indicators I focus on. First, the Duke-CFO survey, which has been going on for 25 years, has an excellent track record. CFOs know the capital spending and employment plans before the plans are executed. Two-thirds of the U.S. CFOs believe a recession will begin in 2020. Second, in the policy arena, I focus on anti-growth policies. Currently, both the U.S. trade disputes as well as the specter of Brexit for the UK and EU are anti-trade and anti-growth. Finally, I look at the level of uncertainty in the economy. This one is difficult to measure. Our business cycle is 121 months and counting and the longest on record. It is feeling old and many are questioning the robustness of future growth. Additional uncertainty increases risk and decreases the attractiveness of business investment.
How do you think this will play out?
Harvey: My economic model says growth will decrease in 2020 and perhaps 2021. Given the publicity the yield curve has received, I hope that both businesses and consumers are prudent. The ideal situation is that growth slows and we dodge an official recession – or the recession is mild. This is sometimes called the ‘soft-landing’ scenario. What we want to avoid is a replay of a hard landing associated with the 2008 global financial crisis.